Thanks Andre for the very detailed answer!
As Steve was saying... it is a challenge to represent the complex characteristics with just a single number. And therefore, as you pointed out, a combo of roughness parameters (i.e., numbers) are most likely necessary to better characterize surface morphologies.
By the way, as per the figure I shared in my previous message, where different surface asperities yield the similar Ra values, if we could have the real samples measured via a stylus profilometer, as well as, the
white light interferometry profilometer... then we would see in a very didactic way the differences.
Another comment. Steve highlighted the fact that he had problems regarding differences of reflectivity among different materials (e.g., metals versus ceramics). You worked with tin cold-sprayed coatings (i.e., a single metallic material). Do you think that you may have this reflectivity issue using white light interferometry if you have different phases on your coating surface? If "yes"… if you could coat the surface of the coating with a metallic thin film (e.g., sputtering) just like we do for SEM, would that solve the problem?
Again… thanks for your detailed answer and contribution to the thread.
Cheers!
------------------------------
Rogerio Lima, PhD
Senior Research Officer
National Research Council of Canada
ASM Thermal Spray Society (TSS) Vice President
------------------------------
Original Message:
Sent: 06-28-2022 10:16
From: Andre Liberati
Subject: Roughness standards for thermal spraying
Hi everyone,
Thanks for the interesting question Rogerio, as well as for the answers Chirag and Steven ! You bring up an excellent point about surfaces with similar roughnesses Rogerio, I may have some insight for that.
TL;DR : Sa, Sz, Sq, Sdq, Ssk and Sku are parameters that can be worth considering.
During my PhD, I touched a bit on this trying to measure substrate differences when cold-spraying composites with tin - and given the ease of deformation of tin, it was a bit tricky finding parameters that would illustrate notable differences. I worked with a Zygo white light interferometry profilometer, and measured areal surface parameters (e.g. Sa instead of Ra) but the principles are the same, only applied in 1D instead of 2D. In the end, the parameters I retained were Sa and Sz (the "classics"), as well as Sq and Sdq.
Sq is defined as the "root mean square roughness" and takes into the standard deviation (or error) of your "arithmetical mean roughness" Sa, therefore Sq gives better precision of the "overall roughness" while taking into account how much variation you may have from the average. A simple correlation between Sq and Sa can be viewed here.
Sdq is defined as the "root mean square gradient of the surface" and goes a step further than the previous parameters as it integrates the gradients (i.e. slopes) of the surface. As described in the Zygo Surface Texture Parameter booklet, Sdq is affected both by texture amplitude and spacing. Thus for a given Sa, a wider spaced texture may indicate a lower Sdq value than a surface with the same Sa but finer spaced features. An example illustrates this : 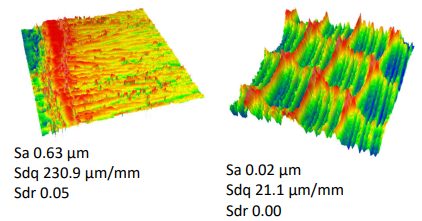
Other parameters that can be very useful to consider are the kurtosis (Sku) - which indicates the presence of inordinately high peaks or deep valleys (Sku>3.00) or lack thereof (Sku<3.00) making up the surface - and the skewness (Ssk), which indicates the the degree of symmetry of the surface heights about the mean plane. The sign of Ssk indicates the predominance of peaks (Ssk>0) or valley structures (Ssk<0) comprising the surface (Zygo).
So depending on the scope of your study, I believe these 6 parameters can help give a good assessment of a surface, but there are quite a few other options. While the Keyence site is a good reference for the parameter formulae, the Zygo Surface Texture Parameter booklet gives good explanations of what the parameters mean, so feel free to send me a message if you wish for me to share it with you.
------------------------------
Andre Liberati
Postdoctoral Fellow
Concordia University
Montréal QC
(514) 813-8021
andre.liberati@concordia.ca
------------------------------
Original Message:
Sent: 06-28-2022 09:23
From: Rogerio Lima
Subject: Roughness standards for thermal spraying
Dear Chirag and Steve,
Thank you for your feedback. It is highly appreciated.
Chirag... I did not know the method you mentioned to measure surface roughness, in which you apply a standard film over the grit-blasted area and press it with a rubbing tool to get the surface profile, and then use a gauge to measure the peak-to-valley roughness. It is quite interesting and I even found a video about it on the Youtube: https://youtu.be/6sxPsDvqeUM
Steve... I just try to imagine the challenges you are facing to characterize the surface roughness of thermal spray coatings to better understand the settlement of marine organisms. And I loved what you said; i.e., ho to attribute a very complex surface microstructure to a single number. You nailed it!
By the way... I am attaching this figure showing surfaces with different morphologies, but with basically exhibiting the same Ra value. For sure a challenge.
Thank you both again for your feedback.
Cheers!
------------------------------
Rogerio Lima, PhD
Senior Research Officer
National Research Council of Canada
ASM Thermal Spray Society (TSS) Vice President
Original Message:
Sent: 06-28-2022 02:57
From: Steven Matthews
Subject: Roughness standards for thermal spraying
Hi Rogerio,
A great fundamental question, and one that is quite topical for myself, as I am working on trying to optimise the surface topography of TS coatings to promote the settlement of marine organisms.....varying grit size in blasting, size of TiO2 feedstock powder, number of deposition passes and post spray grit blasting.
The challenge in this project, and, I suspect more generically for coating adhesion, is to characterise the 3D surface topography, not simply a linear 2D topography. In my case I am trying to optimise the number of 3D bowl-type features of a certain size on the surface for a larvae to settle in.
How to measure the roughness? In the past I have tried to use a noncontact surface profiler, but back then (about 5 years ago) the technique did not work very well with TS coatings due to the difference in reflectivity of the metallic part of the splats versus the oxide layers.....although I understand now that the technology has evolved to overcome this. I have instead used a 3D optical microscope which uses a z stepper stage to take images in the z, and then automatically filter out any details that are not in focus, before stitching the images together in 3D. Works great over a very large range of magnification ranges and sample sizes of up to 100mm, which I have exploited for coating deposition profile charaterisation in 3D.
The next challenge is how to "make sense" of this wealth of 3D information. In looking at the literature on 3D surface characterisation, versus 2D, there are a plethora, or some say a "rash" of different variables that have been proposed, often developed for niche applications. While there are a lot of variables, I have still not found one that will suit my needs! The other challenge I am finding is how to intuitively relate the output of the characteriation, which is usually a single number, to the physical complexity of the surface, in such a way that you can understand what is happening at the surface when the characterisation variable changes in value, in order to relate that back to the core question to begin with.
No easy answer, but a very fruitful area for future research!
Best regards
Steve Matthews
Steven Matthews, PhD
Department of Chemical and Materials Engineering
The University of Auckland, Auckland, New Zealand
Phone: +64 9 9236373 or +64 9 3737599 ext 86373
Associate Investigator - "Surface Engineering for Advanced Materials"